Visualizing GPX Running Tracks
Let me set the scene and help you understand how I got here: Running and I have been in a love/hate relationship for the last ten years. The fundamental problem: While super-accessible, it’s utterly boring! I tried a plethora of tools, habit hacks, and audio consumables to convince myself that setting one foot in front of the other as fast as you can is not only not stupid but rather good for your health. It took me until Covid struck to make running a regular habit and it took me until signing up for my first 5K to take some pride in my hard-earned new hobby.
Part of “professionalizing” (and thereby guilt-tripping myself into not quitting) running was the purchase of a Garmin Vivoactive 4. There were three major reasons for me to go with that brand and model: Reasonable price (150 €), stores and plays my own MP3 music (no need to bring my phone anymore—gigantic plus), satisfies my desire to track my life. (Ok, maybe not life, but I can’t deny a little dopamine squirt when tracking stuff.) So now that I had all my running data at my finger tips, I thought about ways to visualize it.
This brings us to today: I just finished one of the last trainings before my first 5K competition which is special in two ways. Firstly, I have never been faster and although my official goal for the 5K is 35:00, a small part of me thinks that sub-30:00 is actually possible. Exciting! Secondly, I did my run in the green belt of Valencia: Turia Gardens. To understand why this is special you need another piece of backstory: When we last visited Valencia in 2022 during our sabbatical, I was in awe of the athletic people of Valencia and their running, dancing, slacklining, kung-fu-ing, aerobic-ing in Turia Gardens. I weighed 20 kilograms more back then and felt very far from being a healthy, sports-minded person.
Today, I am still on a journey to becoming what I consider a healthy person, but hell I am running with the people of Valencia through Turia Gardens! I am not a bystander anymore! I am doing sports, I am losing weight, and I am exchanging bad habits with healthy ones. This better leads to a long and prosper life because my lungs are killing me right now.
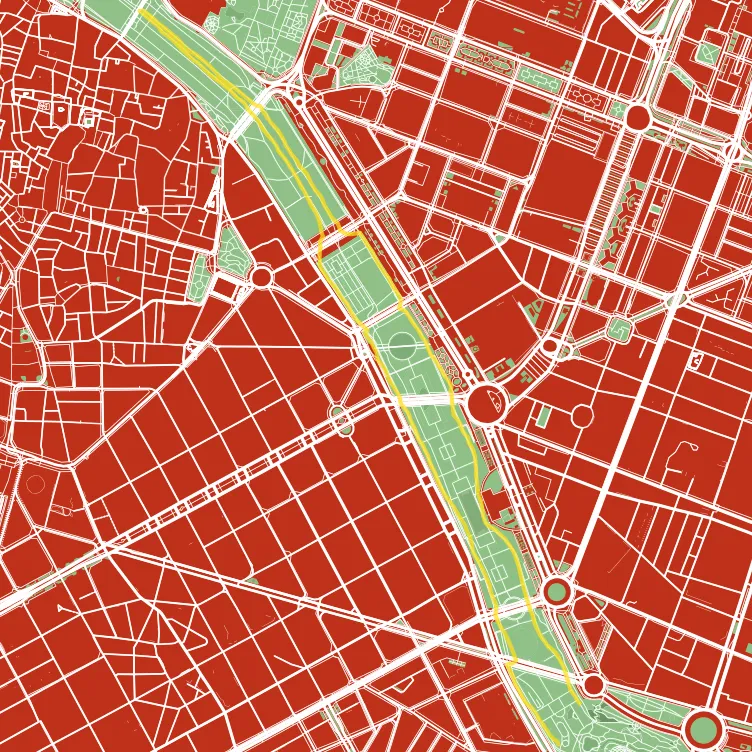
So this explains why I’ve chosen today’s run for my first visualization and I am happy how it turned out. Some notes:
- Garmin has proven to be a more open platform than I expected; I can grab all my running tracks as GPX files, both directly from the watch and from their Connect cloud.
- I used Maperitive to render the GPX track on top of OpenStreetMap data. Maperitive also supports SVG exports. (With helpful groups/layers to work with later in Inkscape.)
- The map-making tutorials of IronEcho Design really helped me with Inkscape to turn the map SVG export into something I would call aesthetically pleasing. Thanks, Rick!
- I considered rendering map and GPX track in Leaflet but decided that adding interactivity to a map of Valencia with a stain that is my running track wouldn‘t add any value. I will revisit Leaflet once I do more complex maps that benefit from being dragged around.
- I used colors inspired by Valencia’s flag (#BF311A, #FFDF1C) and of course the green of Turia Gardens (#A5DD9B).
Getting the map data into Inkscape and playing around with fills, strokes, and colors was incredible fun and you can expect more experiments around visualizing spatial data from me.